Cross-correlograms#
Link to the code on GitHub.
To install the module, run the following command:
pip install git+https://github.com/FinalSpark-np/np-utils.git#egg=np_utils[CCM]
Cross-correlograms (cross-correlation histograms) are used to analyze the temporal relationships between two sets of event times.
They are particularly useful for analyzing neural spike data and understanding the interactions between different channels; such as the synchronization of neural activity between different neurons, or complex patterns of co-activation between different sites, such as oscillatory activity.
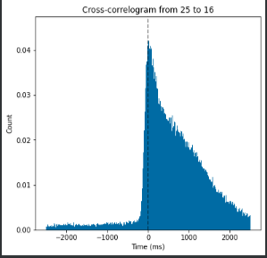
Fig. 21 An example of a cross-correlogram. The x-axis represents the time difference between the two events, and the y-axis represents the normalized number of events in each bin (probability density function).#
For further examples and characterizations of this tool, please see Tsubo & Shinimoto, 2023.
Note
This module requires numba to be installed in your environment.
Some functions also require neuroplatform access (no booking required).
Creating a cross-correlogram and parameters#
Setting parameters#
To start computing cross-correlograms, initialize the CrossCorrelogram class with the desired time window and bin size.
The time window is the duration of the cross-correlogram in milliseconds
The bin size is the width of each bin in milliseconds.
Optionally, you can set the normalize parameter to True to normalize the cross-correlogram by the square root of the product of the number of events in each dataframe.
While bin sizes ten times smaller than \(\Delta t\) are recommended, the most critical aspect in capturing the temporal structure of the data is the time window \(\Delta t\).
Make sure to use a \(\Delta t\) that corresponds to the time scale of the phenomena you are interested in.
Be careful when including stimulation in the analysis, as it can introduce artifacts in the cross-correlogram.
The recommended amount of data varies depending on the activity of the electrode and the phenomena you are interested in, but is generally minutes or hours.
Tip
You may also compute auto-correlograms by passing the same dataframe to both the df1 and df2 parameters.
When doing this, use the hide_center_bin parameter to hide the central bin, which might otherwise hinder the readability of the cross-correlogram.
Example initialization#
from np_utils.cross_corr import CrossCorrelogram

cc = CrossCorrelogram(
    deltat=50, bin_size=1, normalize=True
)  # deltat and bin_size in ms
Computing and plotting cross-correlograms#
Single CC#
Then , you may want to use one of the following provided methods:
compute_from_db#
Compute the cross-correlogram between two channels from the database.
Note : requires neuroplatform access to be used.
Parameters:
fs_id (str): Experiment name, provided by your token.
channel_from (int): ID of the first channel (from 0 to 127)
channel_to (int): ID of the second channel.
start_time (pd.Timestamp): Start time for the analysis.
end_time (pd.Timestamp): End time for the analysis.
normalize (bool, optional): Normalize the cross-correlogram. Defaults to the value set for the class.
check_for_triggers (bool, optional): Check for triggers in the provided times for the channels. Defaults to False.
keep_dfs (bool, optional): If True, returns the dataframes used for the analysis. Defaults to True.
hide_center_bin (bool, optional): If True, the center bin is hidden. Defaults to False. Useful for auto-correlograms.
Returns: np.ndarray: Cross-correlogram array.
compute#
Computes the cross-correlogram between the Time column of two dataframes.
Parameters:
df1 (pd.DataFrame): First dataframe.
df2 (pd.DataFrame): Second dataframe.
start_time (pd.Timestamp, optional): Start time for the analysis.
end_time (pd.Timestamp, optional): End time for the analysis.
normalize (bool, optional): Normalize the cross-correlogram. Defaults to False.
Returns:
np.ndarray: Cross-correlogram array.
plot#
Plots the cross-correlogram.
Parameters:
cross_corr (np.ndarray): Cross-correlogram array to be plotted.
from_ (str, optional): Name of the first dataframe for the plot title.
to_ (str, optional): Name of the second dataframe for the plot title.
ax (plt.Axes, optional): Axes object to plot on. If None, a new figure is created.
Multiple CC#
compute_cc_grid_from_db#
Compute a grid of cross-correlograms between sources and targets from the database. Note : requires neuroplatform access to be used.
Parameters:
sources (list): List of source channels.
targets (list): List of target channels.
fs_id (str): Experiment name, provided by your token.
start_time (pd.Timestamp): Start time for the analysis.
end_time (pd.Timestamp): End time for the analysis.
check_for_triggers (bool, optional): Check for triggers in the provided times for the channels. Defaults to False.
Returns a 3D numpy array of cross-correlograms, with dimensions (len(sources), len(targets), len(cross_corr)).
plot_cc_grid#
Plot a grid of cross-correlograms.
Parameters:
cross_corrs (np.ndarray): 3D numpy array of cross-correlograms.
channels_i (list): List of source channels. If None, all channels are shown in order.
channels_j (list): List of target channels. If None, all channels are shown in order.
n_rows (int, optional): Number of rows in the grid. Defaults to 8.
n_cols (int, optional): Number of columns in the grid. Defaults to 4.
avoid_symmetry (bool, optional): If True, only the upper triangle of the grid is plotted. Defaults to True.
Comparing cross-correlograms#
To compare two cross-correlograms, you can use the plot_comparison method. This method plots two cross-correlograms on the same figure for comparison.
plot_comparison#
Plots a comparison of two cross-correlograms.
Parameters:
cross_corr1 (np.ndarray): First cross-correlogram array.
cross_corr2 (np.ndarray): Second cross-correlogram array.
from_ (str, optional): Name of the first dataframe for the plot title.
to_ (str, optional): Name of the second dataframe for the plot title.
ax (plt.Axes, optional): Axes object to plot on. If None, a new figure is created.
label1 (str, optional): Label for the first cross-correlogram.
label2 (str, optional): Label for the second cross-correlogram.